Colour Scale
Through this option the colour scale used to visualize the measurement points and the Resistivity/Conductivity/IP/Sensitivity Models can be customized (Figure 352).
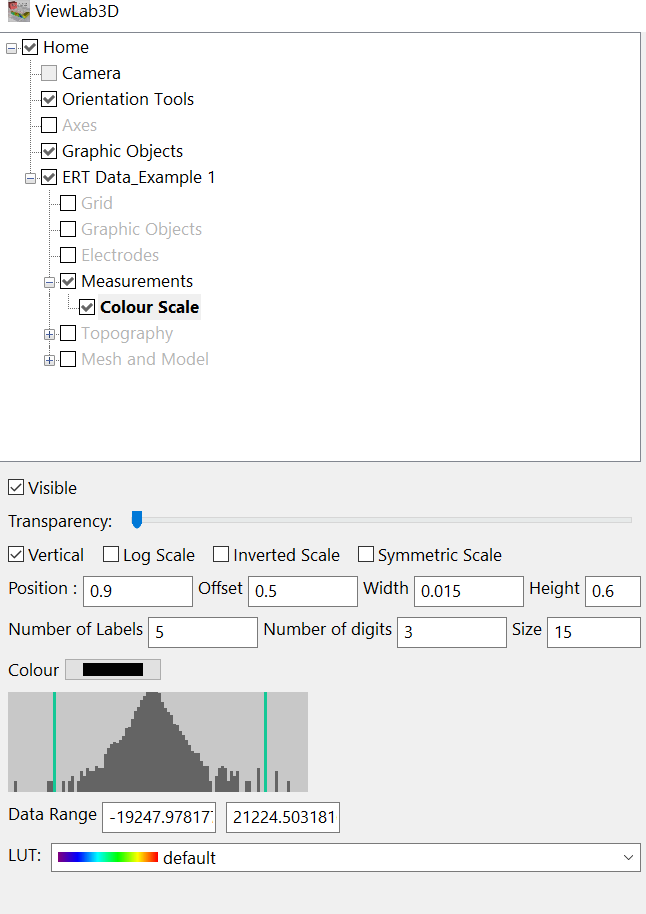
Figure 352 Colour Scale panel
Visible
Controls the colour scale visibility in the 3D space (Figure 353).
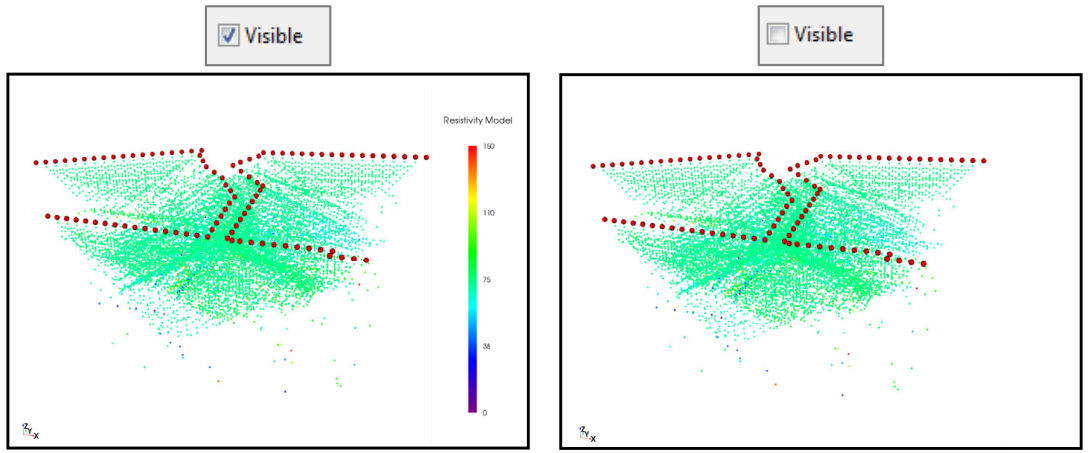
Figure 353 Setting of visibility of colour scale in measurement node
Transparency
This slider sets the transparency of the colour scale (Figure 354). As the slider shifts to the right, the colour scales become increasingly transparent.
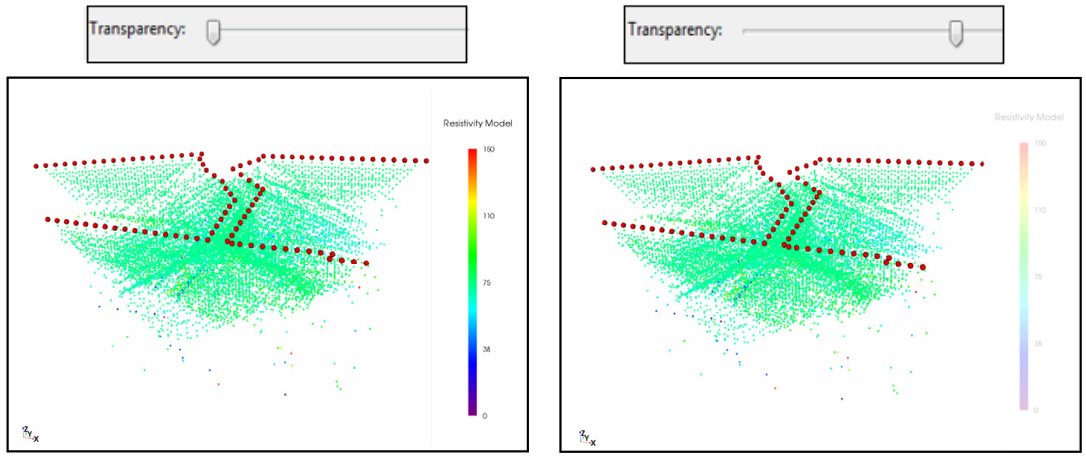
Figure 354 Different levels of transparency of the colour scale.
Vertical
Select the position of the colour scale. If checked, the colour scale is in vertical position; otherwise it is displayed horizontally in the 3D space. (Figure 355)
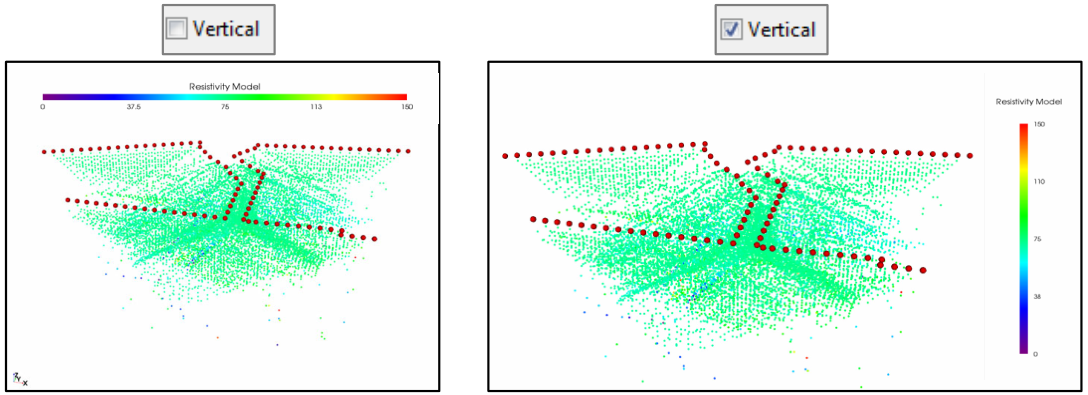
Figure 355 Colour Scale in horizontal and vertical position
To better appreciate the other options in the following examples the colour scale refers to the Resistivity Model and not to measurement points.
Log Scale
Turns the scale from linear to logarithmic (Figure 356). The colour of the scale are the same, but the step values are different (the number at the centre of the bar is 36 in logarithmic scale and 75 in linear scale). Consequently, also the representation mode of resistivity model changes and in some cases it helps to better appreciate the resistivity variation of interest.
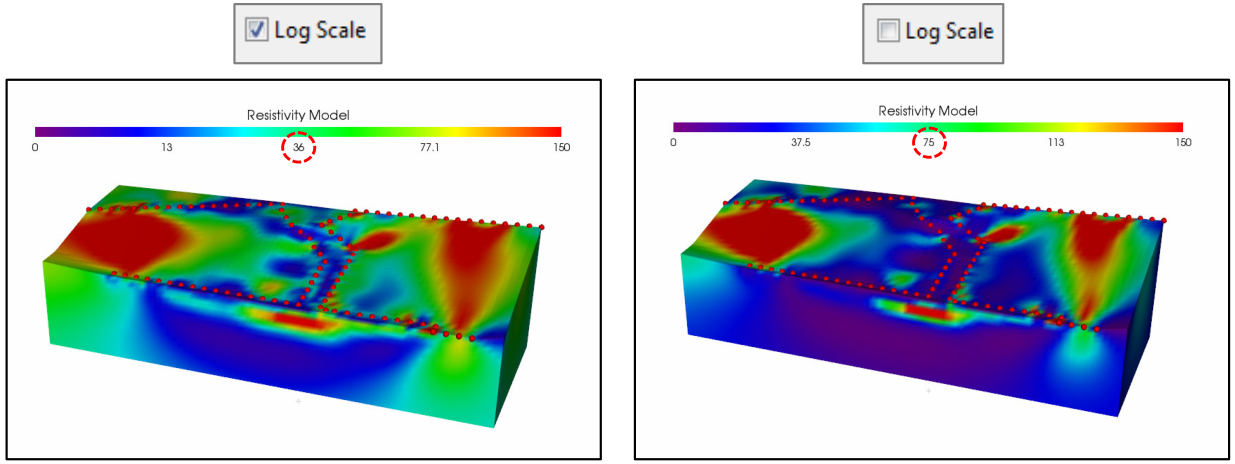
Figure 356 Example of logarithmic scale, on left, and linear scale, on the right
Inverted Scale
Inverts the colours inside the colour scale, so the colour associate with the maximum value will be associate to minimum value and vice versa. Consequently, the representation of the resistivity model also changes. In the following example, in not-inverted colour scale the minimum value corresponds to the purple colour; in the Inverted Scale to red (Figure 357).
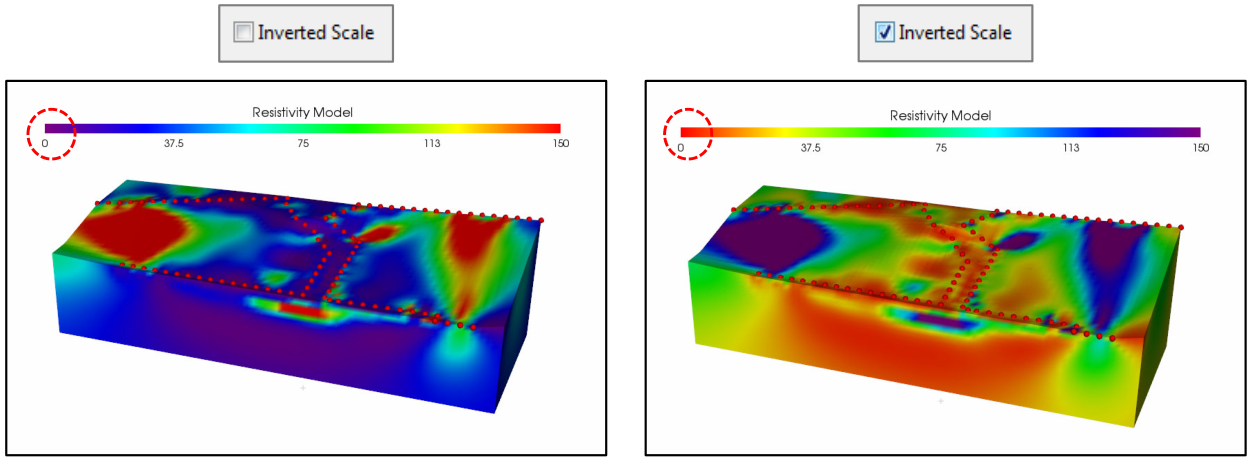
Figure 357 Example of inverted colour scale
Symmetric scale
Checking this box makes the selected colour scale become symmetrical with respect to the centre (Figure 358).
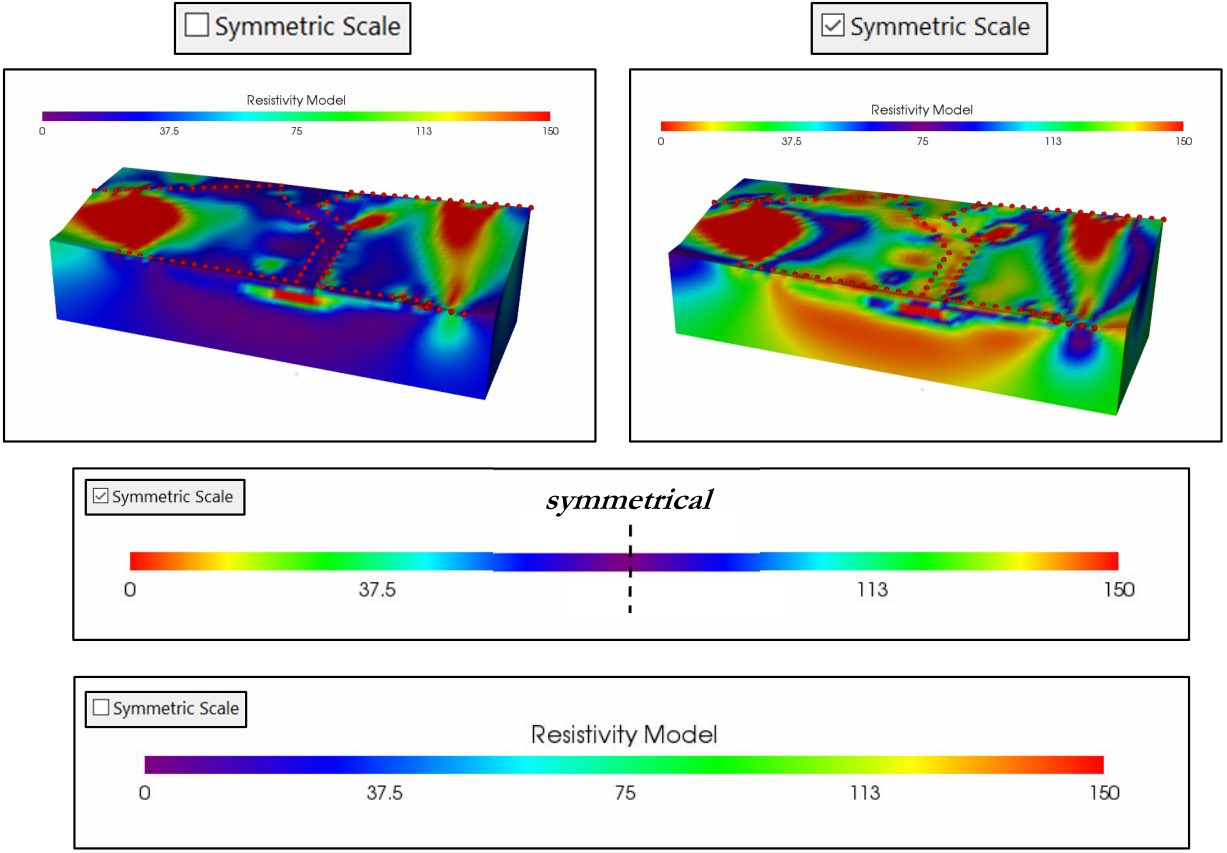
Figure 358 Example of Symmetrical colour scale
Position
Of the colour scale in the scene can be chosen. Typing the desired number (from 0 to 1) in the proper box or using the slider, which appears when positioning the mouse on the box (without clicking) will move the colour scale laterally (vertical checkbox active) and from the top to the bottom if the horizontal mode is active (Figure 359).
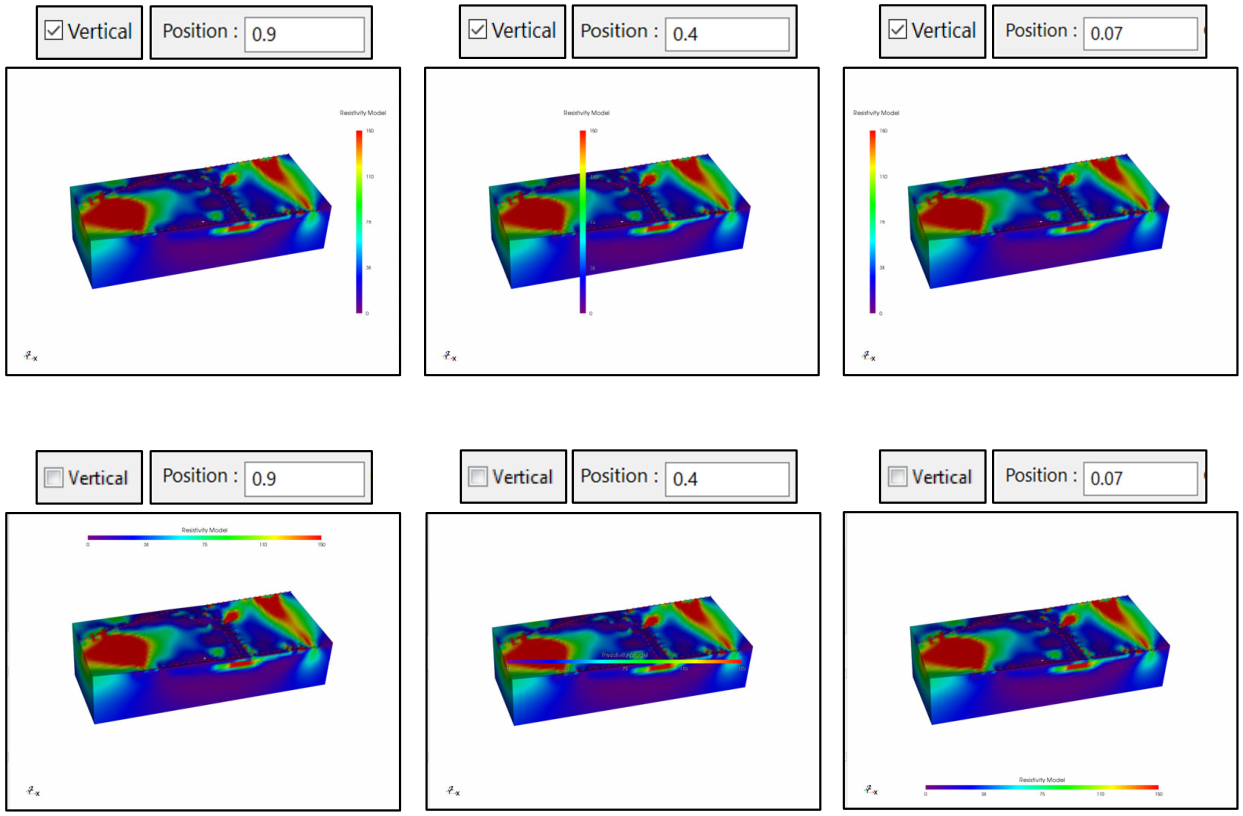
Figure 359 Example of different positions of vertical and horizontal colour scale in the 3D scene
Offset
Through this option the position of the colour scale in the direction perpendicular to those set through Position tool are set (Figure 360).
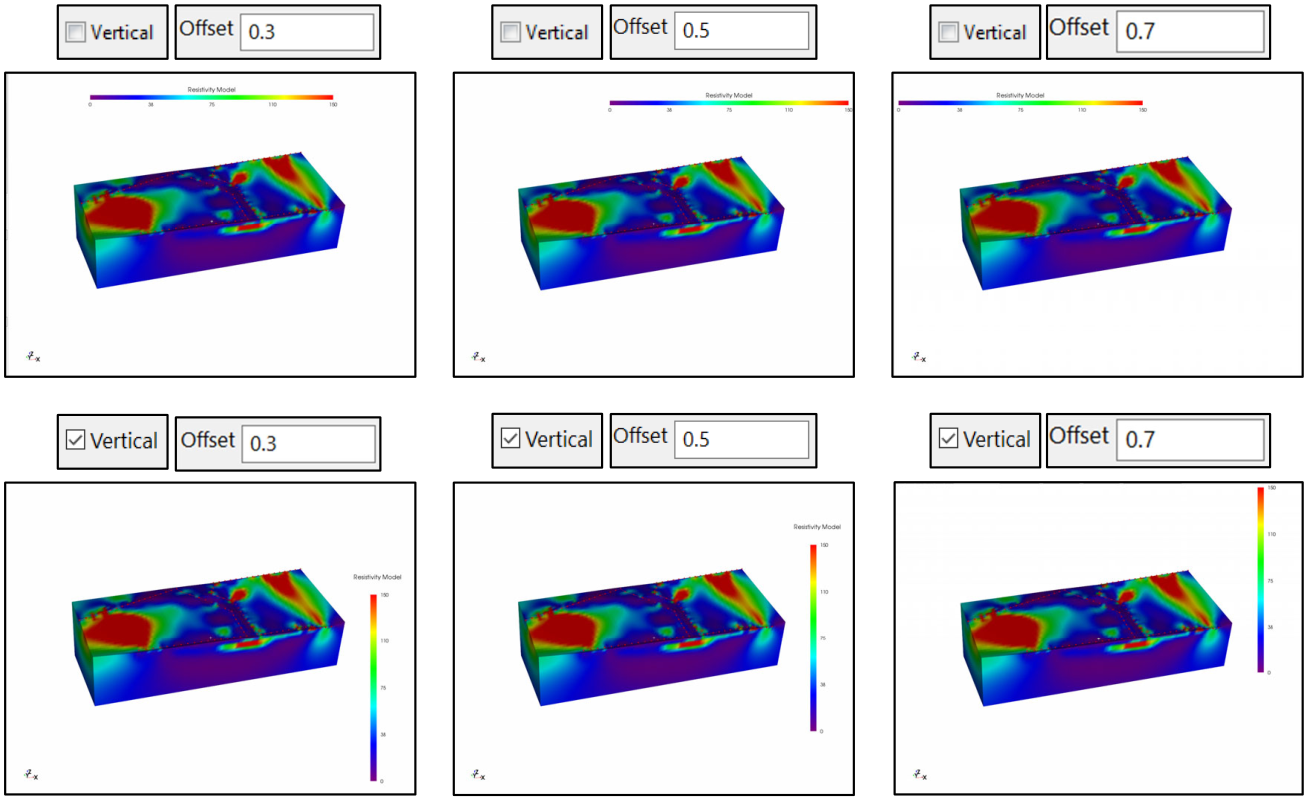
Figure 360 Example of different offset of vertical and horizontal colour scale in the 3D scene
Width
Choose the width of the colour scale. Typing the desired number (from 0 to 1) in the proper box or using the slider, which appears when positioning the mouse on the box (without clicking). Two example of a different width are shown in Figure 361.
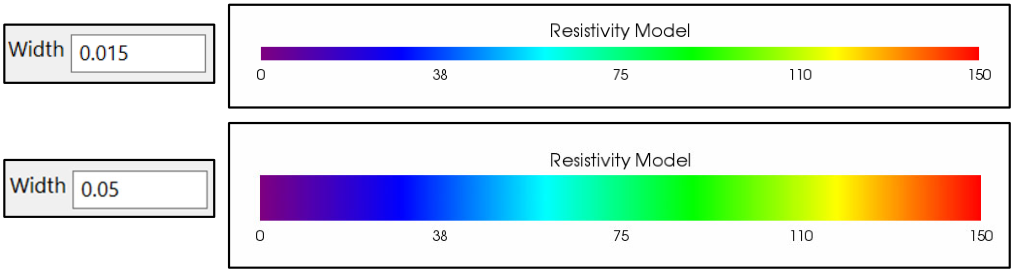
Figure 361 Example of different colour scale widths
Height
Choose the height of the colour scale. Typing the desired number (from 0 to 1) in the proper box or using the slider, which appears when positioning the mouse on the box (without clicking). Two example of a different width are shown in Figure 362.
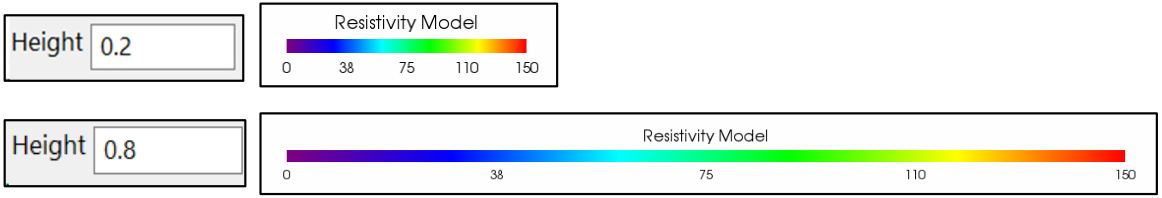
Figure 362 Example of different colour scale heights
Number of labels
Chooses how many labels to display on the colour scale, as it is shown in the following example (Figure 363).
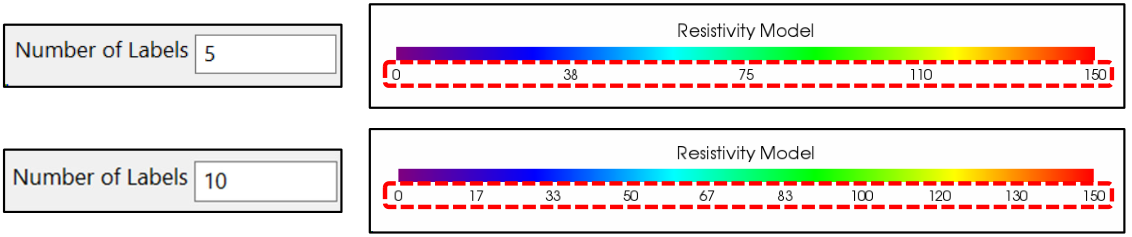
Figure 363 Example of different colour scale number of labels
Number of digits
Choose how many digits to display in the labels of the colour scale, as it is shown in the following example (Figure 364).
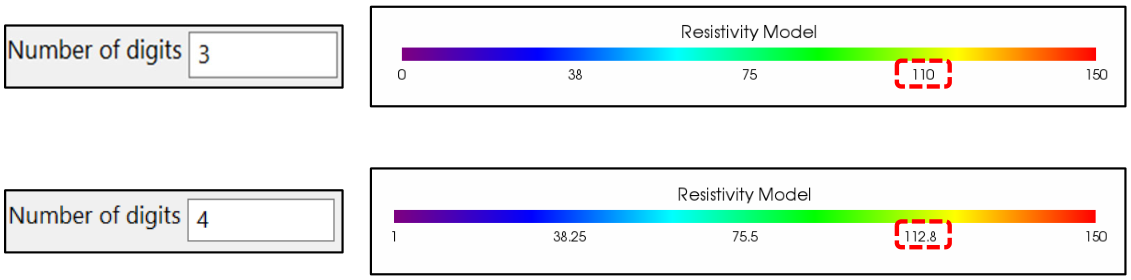
Figure 364 Example of different number of digits of the labels of the colour scale
Size
Scales the size of labels and the title of the colour scale, as it is shown in the following example (Figure 365).
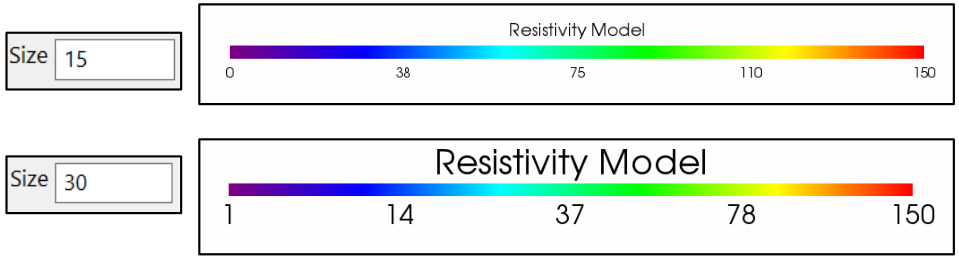
Figure 365 Example of different size of labels and title of the colour scale.
Colour
Selects the colour of labels and the title. It is black by default and it turns in red in the following example (Figure 366).
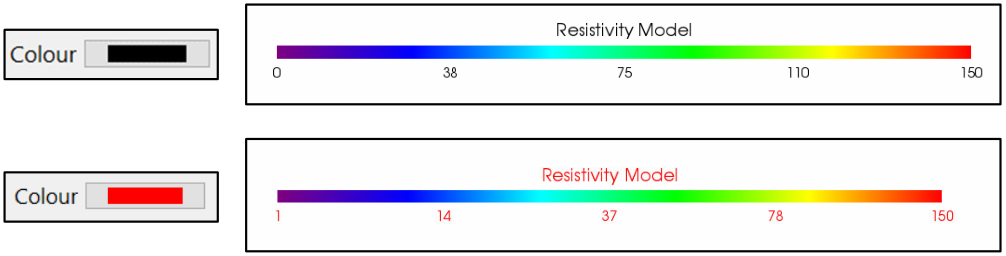
Figure 366 Example of different colour of labels and title of the colour scale.
Data range
Allows to set the minimum and the maximum values of the colour scale. Typing the desired values in the proper boxes, or using the slider which appears when positioning the mouse on the box (without clicking).
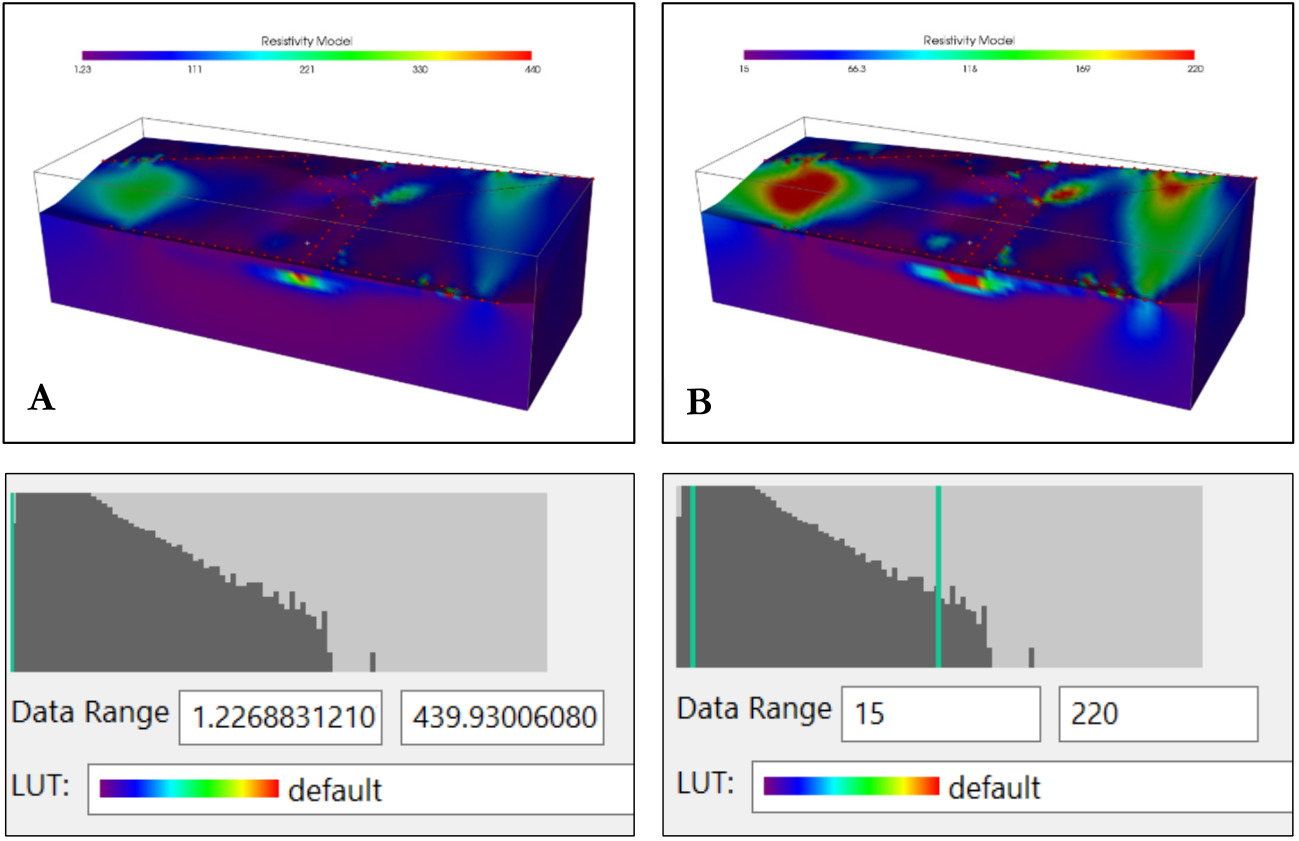
Figure 367 Different data range displayed; in A the data range of Colour scale is 1.22-440 (the entire data set), too wide to appreciate the distribution of the physical property in 3D model; in B the limits of colour scale are 15-220 and the Resistivity distribution is more visible
Automatic minimum and maximum values can be used keeping the “Auto” flag active.
To help the user to set the most appropriate values, a histogram shows the amount of data with the colours distribution. When changing the extreme numbers of the colour scale a low-cut and high-cut threshold bars will appear in the histogram in correspondence of the new minimum and maximum set values. This allows to better visualize the distribution of the physical property of the model (Figure 368).
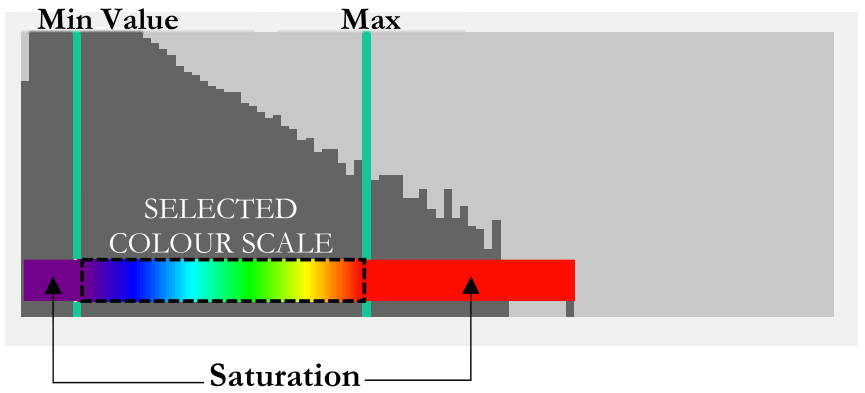
Figure 368 Saturation of Colour Scale in function of minimum and maximum values setting
The selected colour scale occupies the portion of histogram between the two bars, where most of the data are. Outside these cut-off bars the colour bar goes into saturation; this mean that all data from the Max Value until the right end of the histogram are of the same colour (red in the example), without any distinction. The same goes for data from the Min Value until the left end of the histogram, which are all purple in this case (Figure 368).
LUT
Allows to choose the colours of the scale. Figure 369 shows the possibilities available by default. These colour scales are generated from files loaded from the “Colourmap” directory, which is in the installation folder. Each *.lut file correspond to one colour bar in this list. This allows the user to delete or create new ones. You will have to re-start ERTLab Studio to access the new scale.
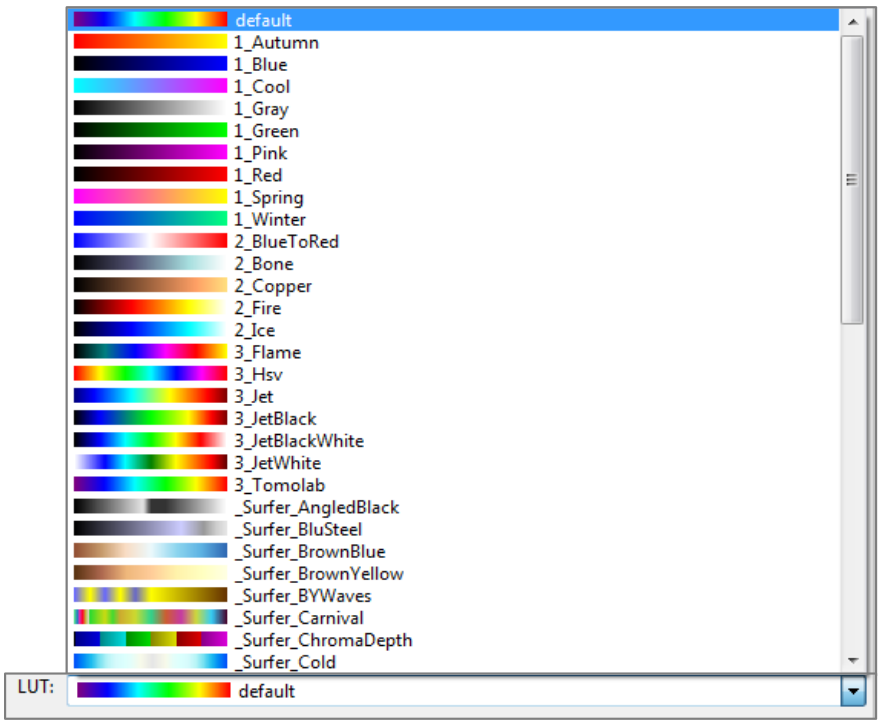
Figure 369 Example of some colours available for the colour map
The colour scale can be edited pressing the “Edit” button
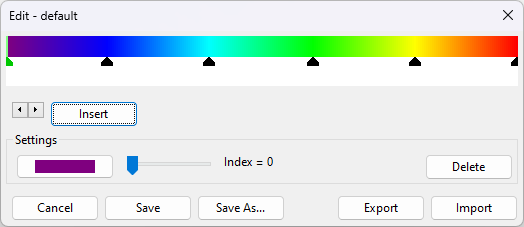
Figure 370 Colour scale editing
The colour scale is usually build starting from a limited number of nodes (see black markers in the figure), interpolating the colours between them. In the editing panel it is possible to change the color related each node, and to change the node position. It is also possible to “Insert” a new node, or to “Delete” the current node. Pressing the “Import” or “Export” buttons on the bottom of the panel it is possible to save/load the color scale to/from a text file. Finally it is possible to save the modified color scale with the buttons “Save” (to overwrite) or “Save As” (to create a new scale, that will be available restarting the software).