Model Volume
this menu option allows to identify the volume of data in the model with the same resistivity/conductivity/IP/sensitivity values, the iso-volume. The window has the following items:
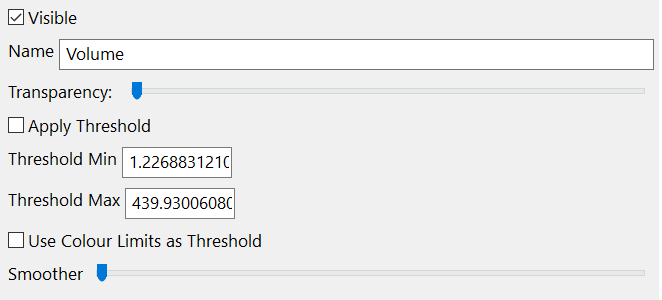
Figure 162 Volume panel
Visible
Sets the visibility of the Volume.
Name
Assign to the Volume (default name) the desired name by typing in the text box.
Transparency
Manages the transparency level of the volume. When the slider is totally at the left the object is completely visible. When it is on the right it is not visible at all and at intermediate positions it is more transparent as the slider goes towards the right. In the following example the volume of the entire dataset and a section are displayed. In the first case (Figure 163, case A) the transparency of the volume is zero and the section is not visible. In the second case (Figure 163, case B) the level of transparency is high and the vertical section appears.
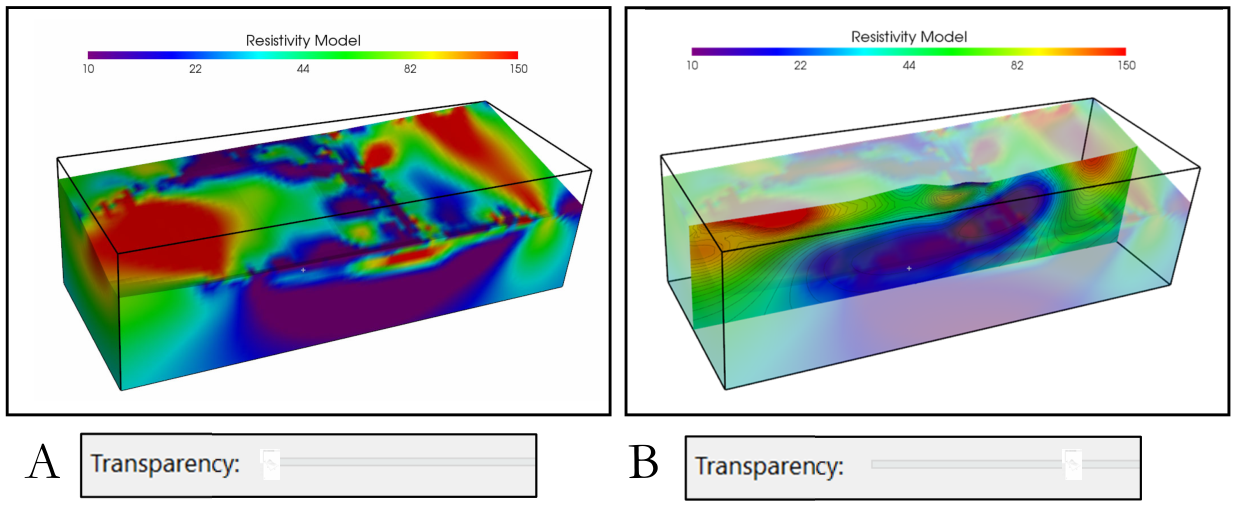
Figure 163 Different levels of transparency in the resistivity volume
Apply Threshold
To visualize a desired volume, type in the desired values in the Threshold Min and Threshold Max boxes and check Apply Threshold to activate the selection. If the box is not checked the entire range of data is shown. In the following example, a low resistivity model, in blue, and a high resistivity model, in red, are shown (Figure 164).
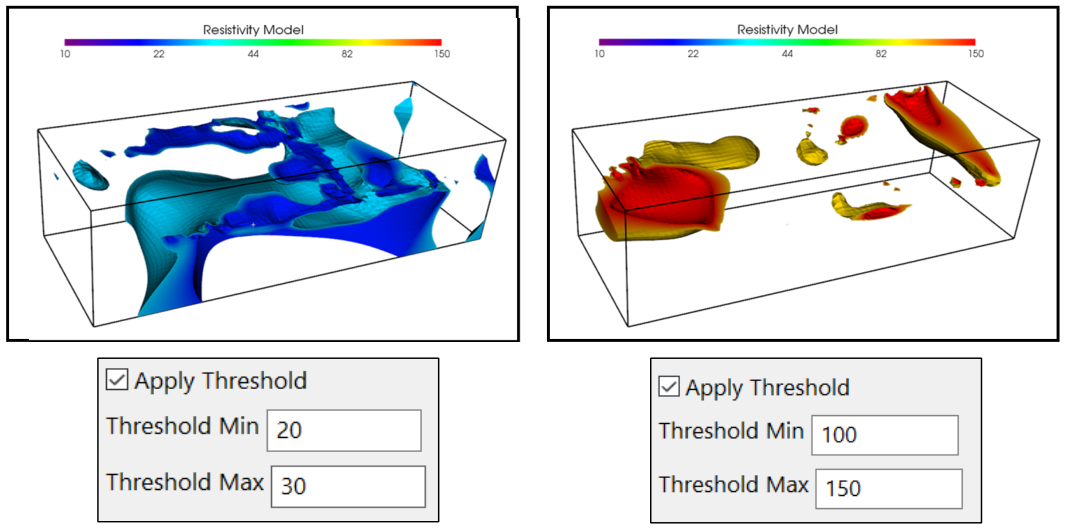
Figure 164 Example of two different volumes threshold applied for the creation of maximum and minimum resistivity volume
To visualize additional volumes at the same time add one Volume node for each sub-selected range values (Figure 165).
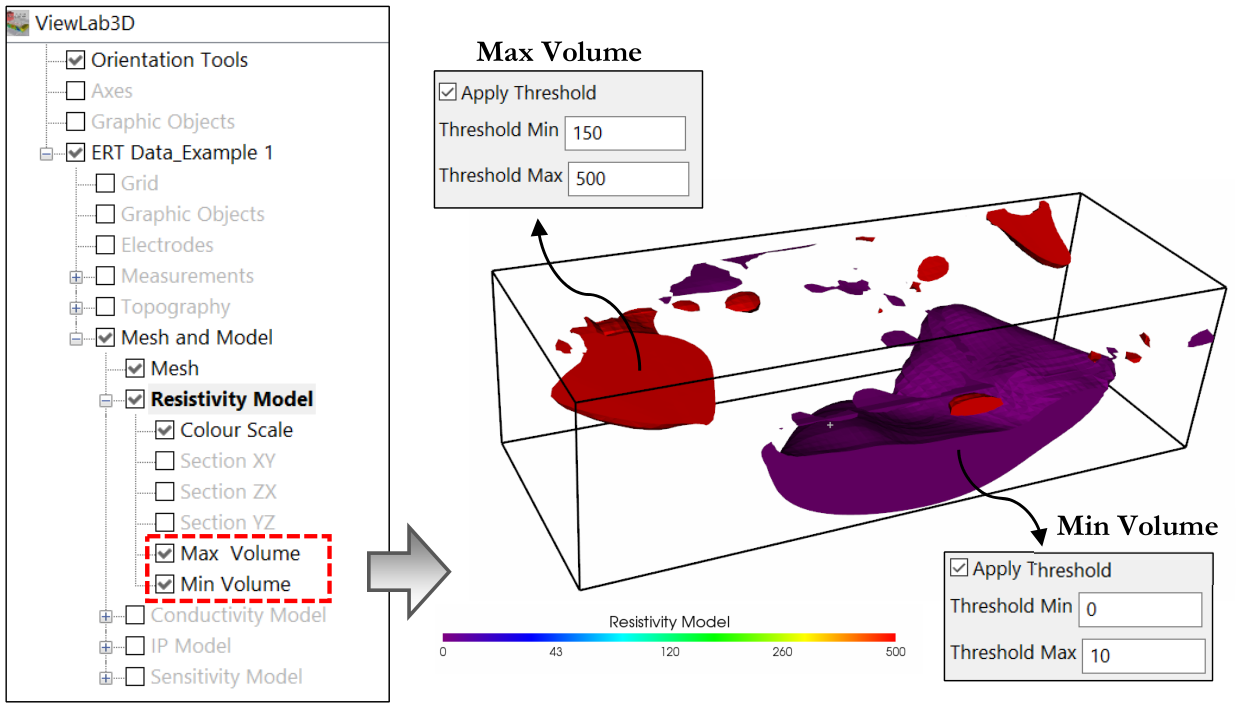
Figure 165 Example of visualization of maximum and minimum volume at the same time
Use colour Limits as Threshold
by default the Threshold Min and Max boxes are set to the minimum and maximum values of the entire dataset. To use the custom extreme values of the colour scale as maximum and minimum value of the volume, check the Use colour Limits as Threshold box (and Apply Threshold to make the selection valid). In this way the saturated area, external to the colour scale value, are cut away from the volume and a “hole” appears in their place.
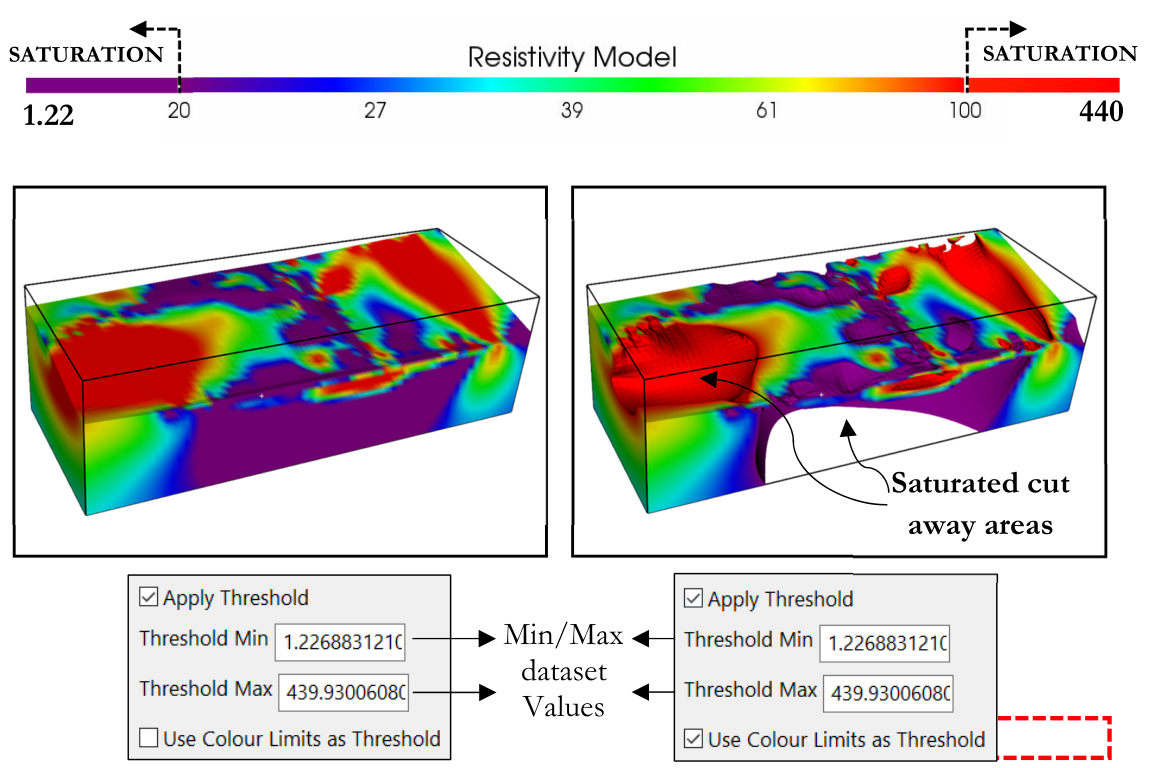
Figure 166 Example of full resistivity model with and without ‘Use Colour Limits as Threshold’ applied
Selecting determinate ranges of values, it is easy to estimate what parts of the investigated area (and in what proportions compared to the entire dataset) have a maximum, medium or minimum resistivity values.
Smoother
Smooth the volume in case they appear to edgy.
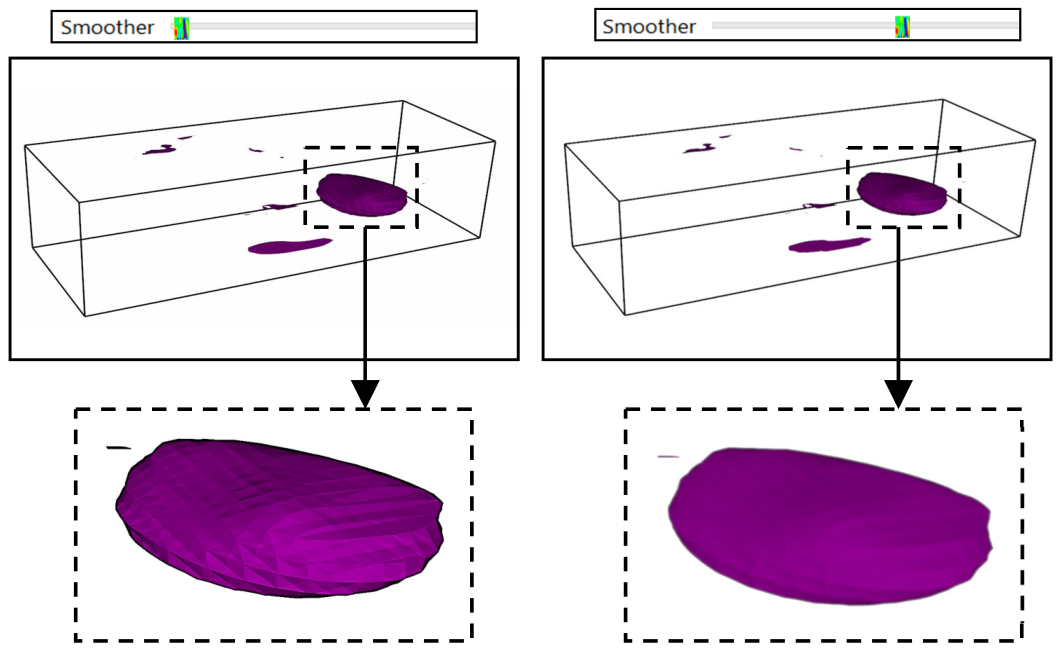
Figure 167 Example of smoother applied to a resistivity volume