Model Isosurface
This option allows to identify the surface in the model with the same resistivity/conductivity/IP/sensitivity values, the iso-surface. The window has the following items:
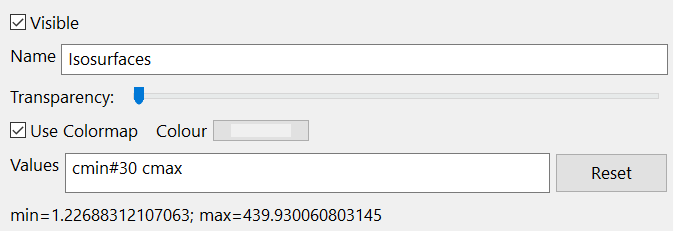
Figure 168 Surface panel
Visible
Sets the visibility of the Surface.
Name
Assign to the Surface (default name) the desired name by typing in the text box.
Transparency
Manages the transparency level of the surface. When the slider is totally at the left the object is completely visible. When it is on the right it is not visible at all and at intermediate positions it is more transparent as the slider goes towards the right (Figure 169).
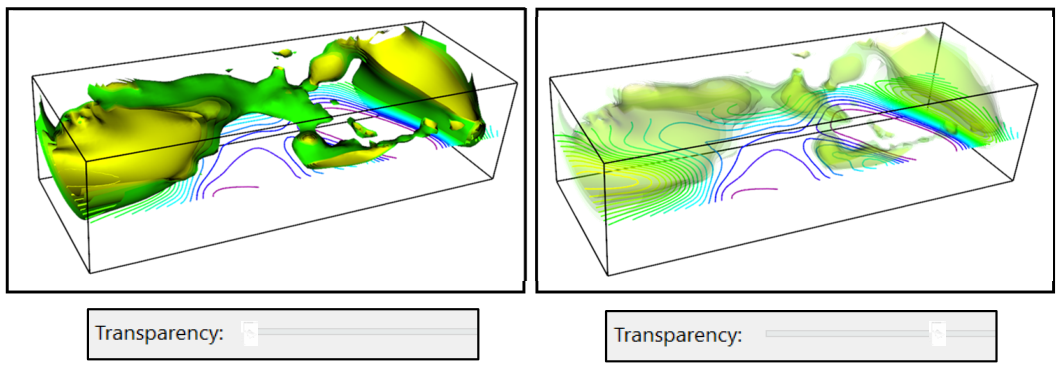
Figure 169 Different levels of transparency applied to an isosurface
Colour
If Use Colourmap is checked the iso-surface is displayed with the same colour as the Colour Scale. If unchecked it is possible to choose a colour from the Colour button (grey in the following example).
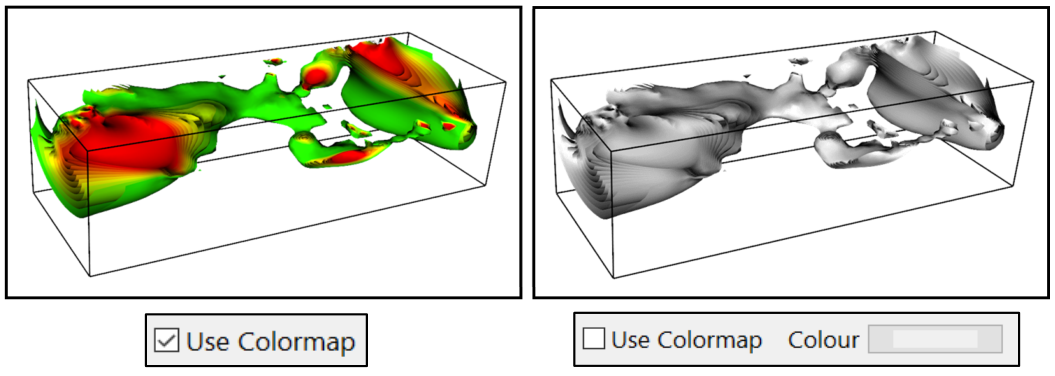
Figure 170 Isosurface of one colour (grey) and with the same colormap colours
Values
Sets the values of the iso-surface to display. It can be a unique value or a range (see section Mathematical Notations for syntax information). Maximum and minimum values of the data set are suggested at the bottom of the window. By default, it is displaying the entire range of dataset values.
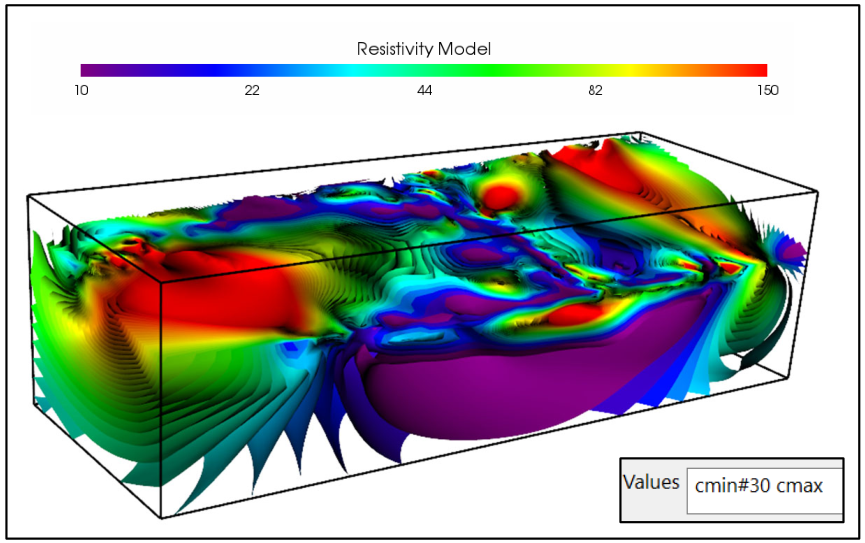
Figure 171 Example of setting iso-surfaces values
In Figure 172 some specific value ranges are selected : 1-10 (very low resistivity), 20-50 (medium-low resistivity), 60-90 (medium-high resistivity), 120-180 (high resistivity).
In all cases the step values from one surface of the next is 2.
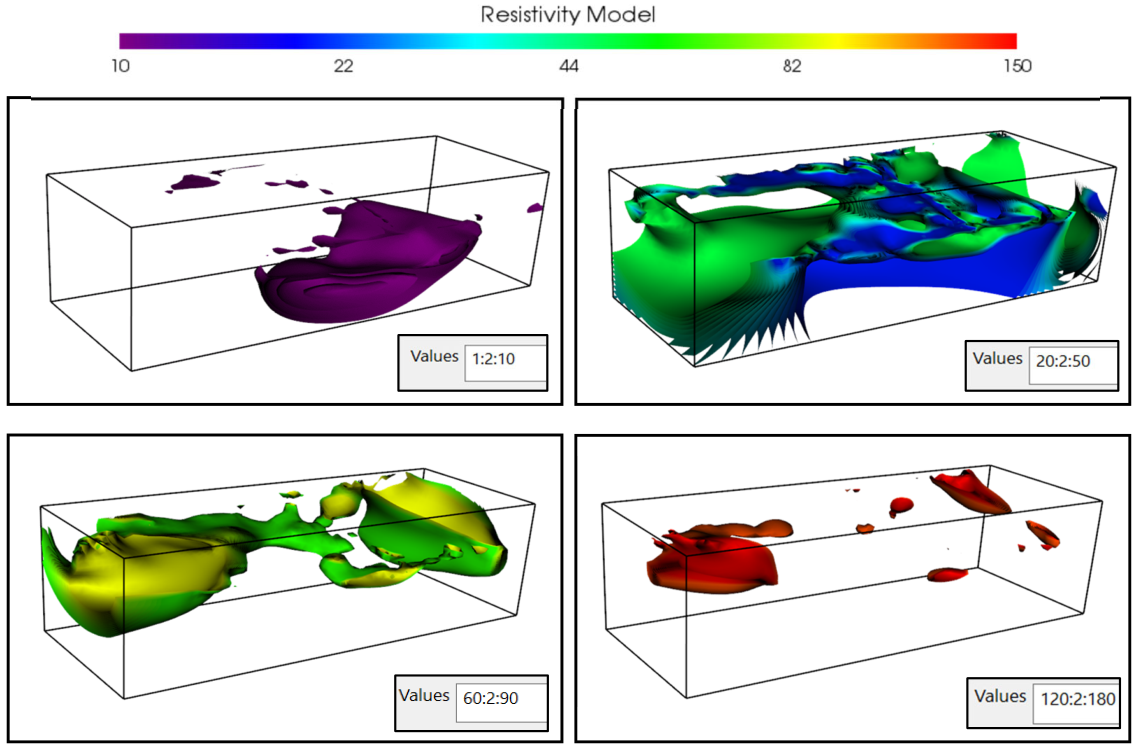
Figure 172 Example of different Iso-surfaces setting values
Multiple
To visualize additional iso-surfaces at the same time add one Surface node for each sub-surface range values Figure 173.
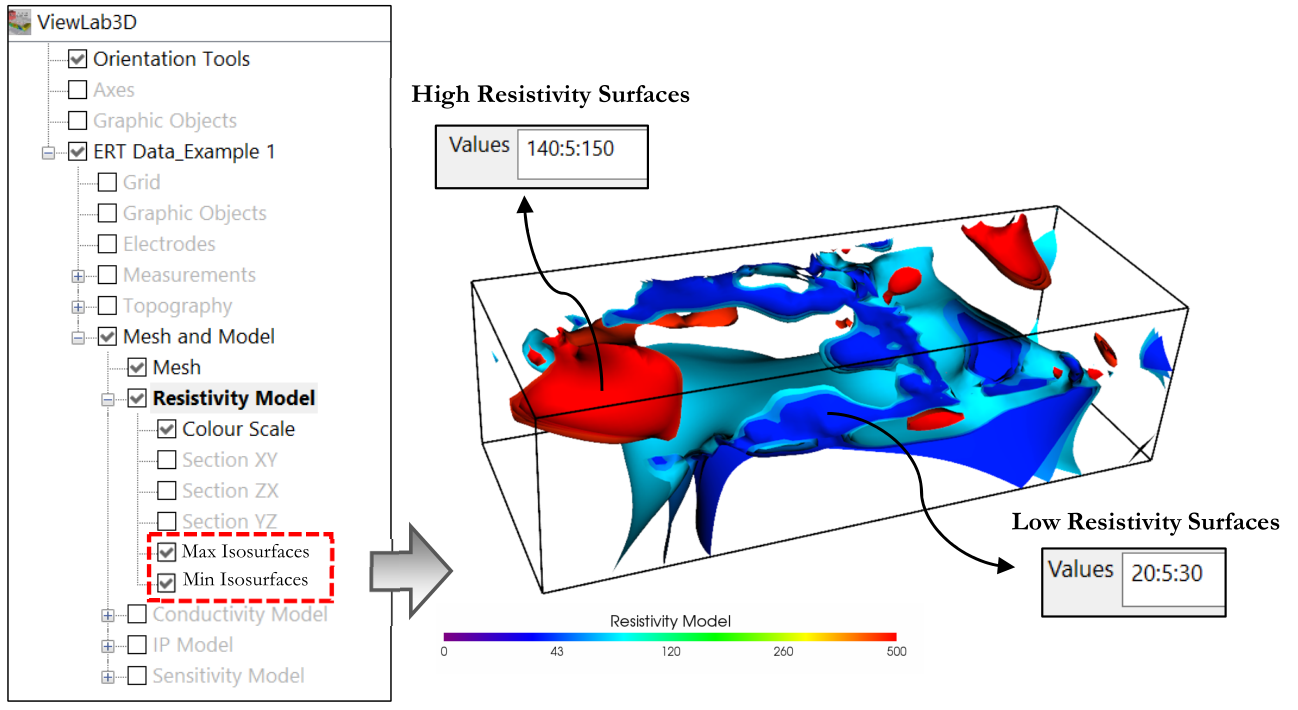
Figure 173 Visualization of two Isosurfaces at the same time